Result-oriented reflection: notes on the recent Stories of Change workshop for the Inclusion Project
Introduction
Last April, the World Citizens Panel team facilitated a Stories of Change reflection workshop in Phnom Penh, Cambodia. Stories of Change is a qualitative research method that above all seeks to allow those who apply it – program designers and implementers – to learn how and why a particular change happens. These program designers and implementers carry out the research themselves, from design phase to the data collection and analysis. This increases the likelihood that the research is relevant to and usable in their work. During a reflection workshop – the last phase in the Stories of Change research process – these researchers are first of all triggered to reconsider the change mechanisms underpinning their interventions. Ultimately, the objective of this reflection is that interventions are adapted to achieve change more efficiently & effectively. But how to practically organize this in a 3-day workshop?
Background of the workshop
The Stories of Change that were analyzed in the reflection workshop in Phnom Penh had been collected since February 2016 by the organizations implementing the Inclusion Project. This regional project, spanning over the period March 2014-July 2017, forms part of Oxfam’s Regional Water Governance Program. It aims to see water governance improved across the Mekong region through the active participation of civil society. The project puts specific emphasis on women’s participation and leadership, a recurrent theme in the collected Stories of Change.
Organizing the first workshop objective: how to reconsider change mechanisms
At the reflection workshop in Phnom Penh in April, a critical analysis was nurtured by the following components:
- Use of a generic analytical framework
For many workshop participants, it was their first time to make a more abstract analysis of the change processes that they work on with their organizations. In order to support them in this first analytical exercise and because many research questions related to a change in behaviour, it was suggested to participants to use a behavioural change framework for the preliminary analysis of their stories. This framework consists of four main categories of factors that can influence a change process: motivation, ability, psychological capital and supportive environment. In all four categories, factors can both be barriers to change (e.g. lack of motivation) and enabling factors (e.g. being intrinsically motivated to change). Using this framework as a starting point, participants could dissect their stories, and identify and categorize change factors which were mentioned in their stories. But through the use of this framework, many participants also discovered gaps in their stories, i.e. information for one or more categories of change factors which were not mentioned. This analytical lens triggered participants to critically reflect both upon the questions they should have asked during their Story of Change interviews and upon their organization’s interventions and how these related to other factors in the wider change process.
- Additional literature review
To fill these gaps, participants noted new questions for future Story of Change interviews and immediately carried out additional literature review. The workshop facilitator had provided a list of suggested reading material, but participants also added other relevant papers. This combined analysis not only helped to enrich the analysis of the Stories of Change, but also challenged participants to think about possible additions or changes to their organization’s interventions.
- Interactive reflection
Throughout the workshop, the participants interacted by reading each other’s stories, giving feedback to initial analyses in group discussions and commenting on final presentations in plenary sessions. Workshop facilitators in Phnom Penh and researchers in The Hague also provided instant feedback and hands-on support.
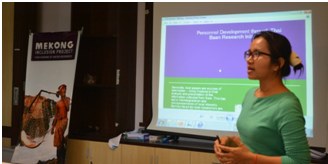
Participant giving her final presentation
These three components helped participants to take a critical look at their change mechanisms, but a fourth element was needed in more ample measure in order to add more richness to the analysis: time. That is why several participants continued working on their analysis in the weeks after the workshop.
Organizing the second workshop objective: how to adapt interventions
The ultimate objective of a Stories of Change reflection workshop is to draw lessons that can help to bring about change more efficiently & effectively. But a common challenge for such learning processes is to assure the actual implementation of the lessons learned. In the workshop in April, two solutions were tested:
- Participants develop their own info-graphic
The first goal was to make participants develop their own knowledge product, assuming that such an active engagement with their research topic would lead to internalization of the lessons learned. The second goal was to allow participants to go back to their organizations with a presentable product of their reflections during the workshop. The assumption was that if participants actually have something tangible and useable to show after a workshop, they will indeed share this with colleagues, use it for external communication purposes and eventually apply the knowledge to (re)shape (existing) interventions.
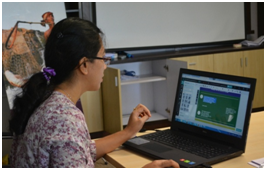
Participant designing an info-graphic with Piktochart
But what kind of tangible and useable knowledge product can be fabricated in the span of a 3-day workshop, including preliminary analysis etc.? Given our previous positive experiences in terms of ease of development & actual use, we decided to make participants develop info-graphics. Info-graphics can easily be shared, used for external communication and for program adjustments or designs. Because all workshop participants were computer-literate, had their own laptop and could rely on a decent internet connection, we chose to make use of the user-friendly and free online tool Piktochart. Using a pre-designed template and building upon their story analysis and literature review of the first two days, all participants managed to produce a rough but presentable version of their info-graphic in about three hours (see examples of updated versions from CDPO, CSRD and GreenID).
- Participants develop their own learning strategy
In order to offer participants an extra lever to make use of their info-graphic, they were asked to develop a learning strategy. In this strategy, the participants had to include answers to the following questions:
- Who (in my organization) can benefit from the knowledge generated through the Stories of Change research (i.e. “intended users”)?
- At which moments can they use this knowledge?
- How can I engage with these intended users?
- How can I follow up with the intended users to facilitate and enhance use?
The learning strategy was developed via the online survey tool FluidSurveys. The rationale was again to ensure that the participants could take a tangible product back to their organizations, ready for immediate use. In the FluidSurveys questionnaire, participants could fill out their answers to the questions and instantly have them exported to a finalized strategy, while the Inclusion Project coordinator also automatically collected all learning strategies in the online database.
Conclusion
It remains to be followed up to see to which extent the info-graphics developed during the Stories of Change reflection workshop in April will actually be used by the workshop participants and their organizations to adapt their interventions. Promising signs so far are several participants’ efforts to fine-tune the draft versions in the weeks after the workshop. Some participants have already presented their info-graphics to their colleagues, and one participant even drafted instructions in Vietnamese for her colleagues on how to make info-graphics. And to give the final word to one of the participants: “I have just finished the sharing event with my colleagues. They felt really interested in the tool and the info-graphics.” It’s a first step towards result-oriented learning, but it’s a step in the right direction on a long and winding road…
***
These are inspired on the model proposed in “Changing Employee Behaviour” by Nik Kinley and Shlomo Ben-Hur 2015).
This was a broadly shared feeling at Oxfam Novib’s Expert Meeting in March 2016 on “Measuring the impact of development projects for learning and adaptation”.
See i.a. our clickable info-graphics on family planning in Pakistan here and on the Ebola response here.


